Design experiments, analyze data, and make figures in Experiment.
How to use it
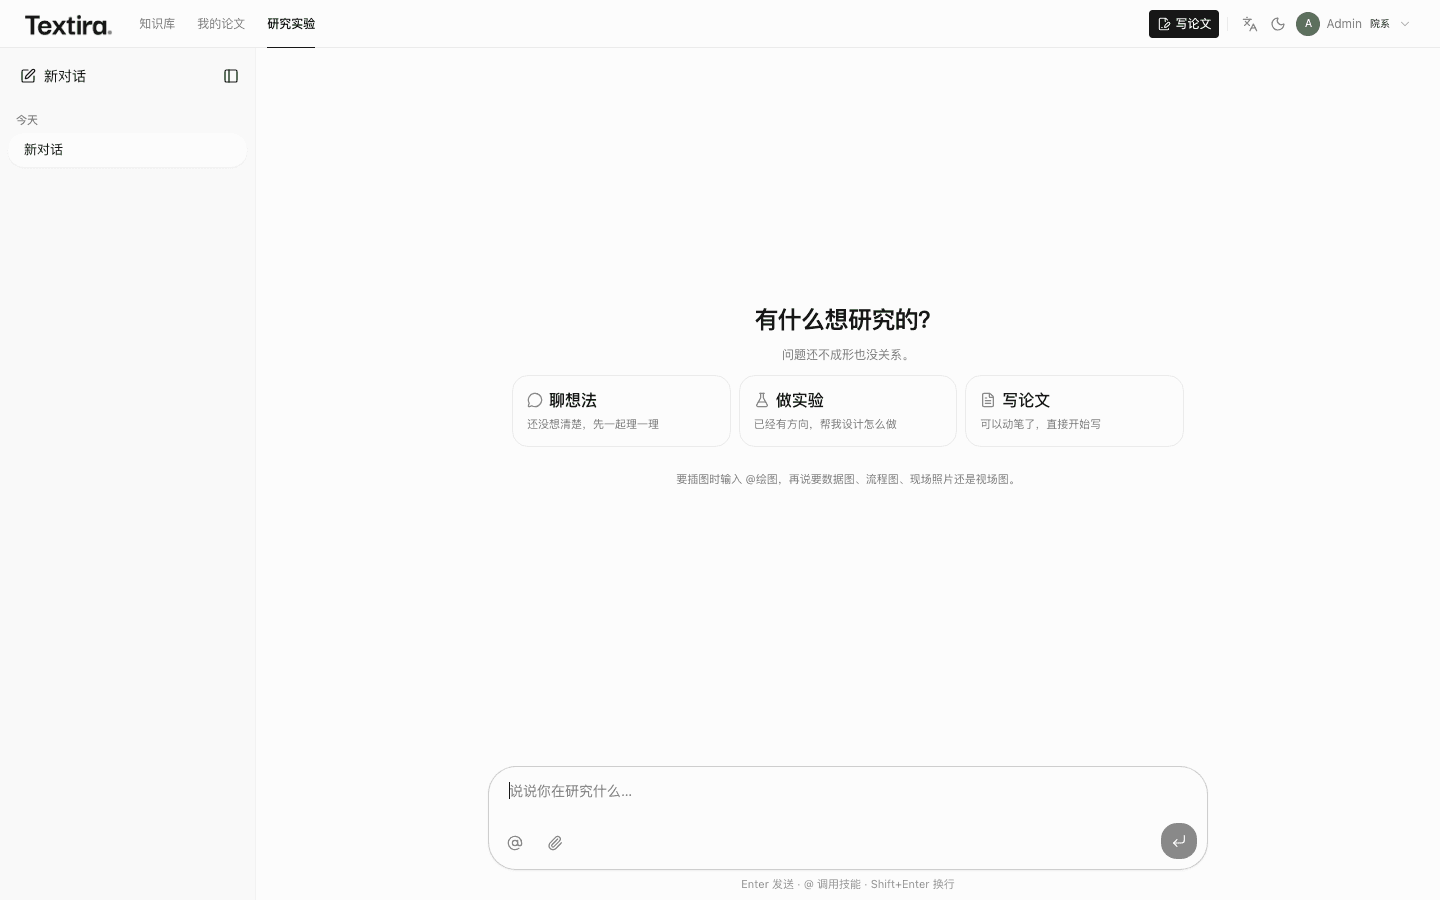
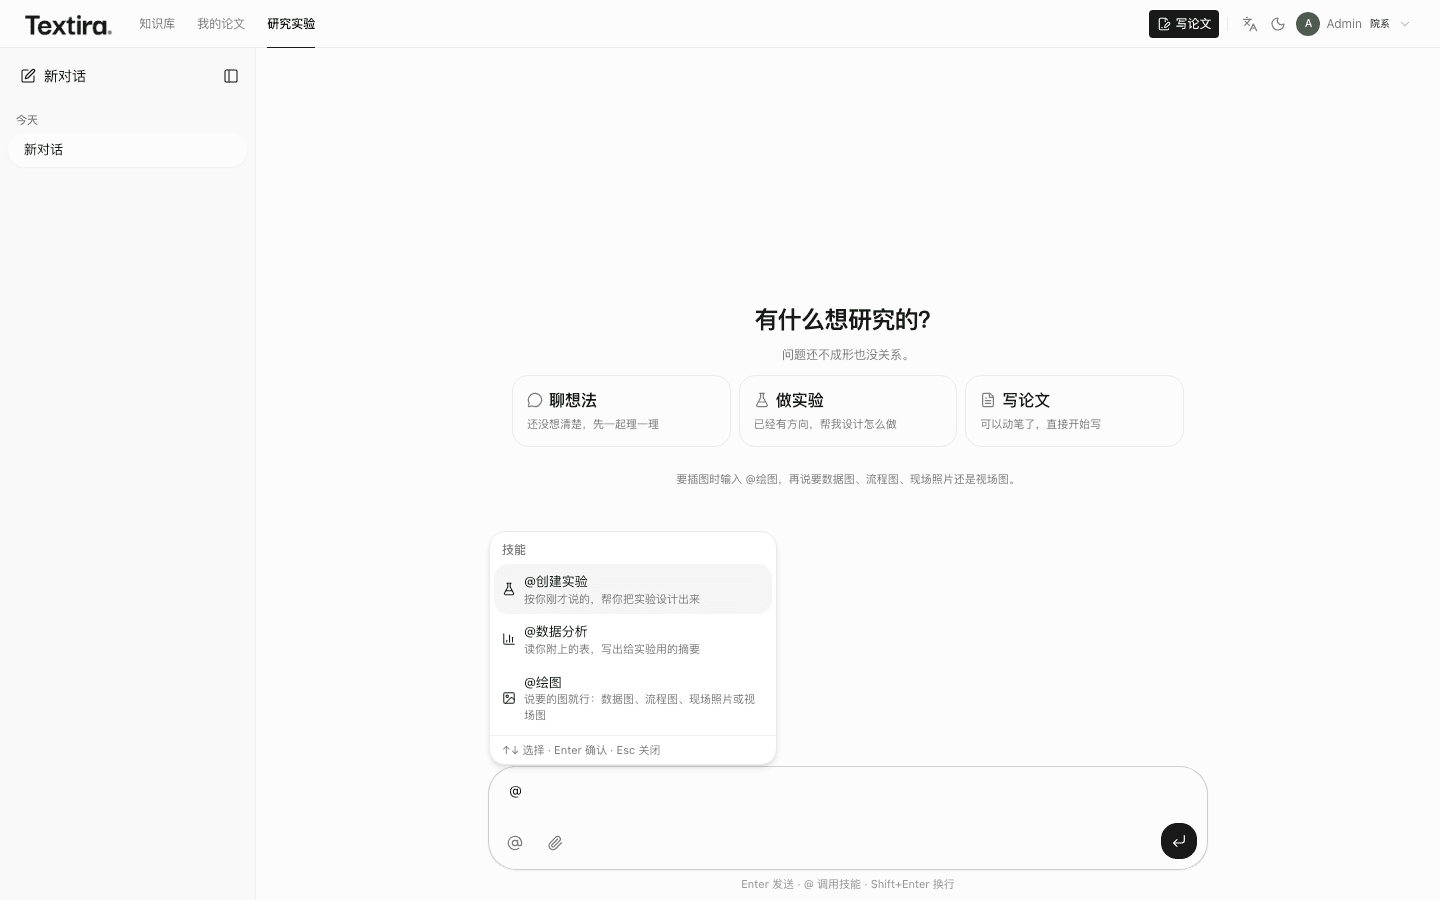
Open Experiment. Chat, design a run, or start writing. Enter sends. Type @ to pick a skill.
- Open Experiment.
- Pick a card, or type what you are studying.
- Type @ for Create experiment, Data analysis, or Drawing.
Tips
- Do not put demo numbers into a submission.
What the charts look like
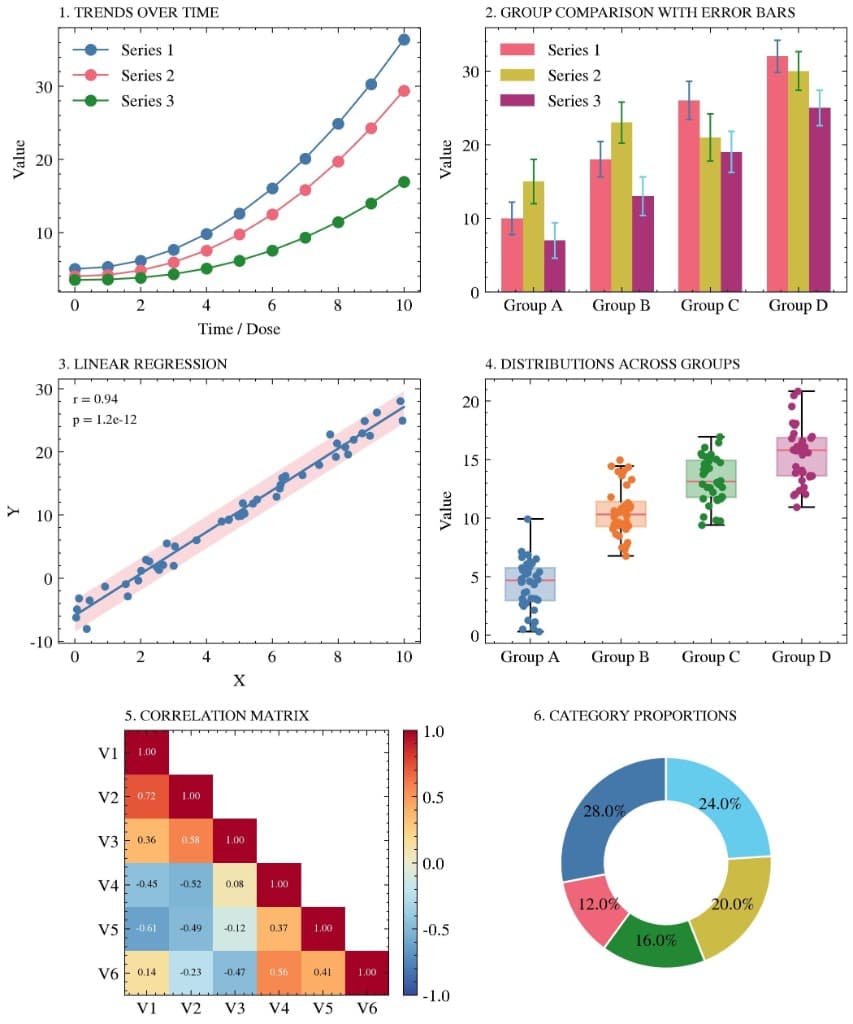
Data charts use this one journal style. Colours do not change with the conference or journal you picked. Lines for trends, grouped bars with error bars, a fitted scatter, boxes with points, a lower-triangle correlation matrix, and a donut for shares.
Tips
- The numbers are a sample, not your results. Plot from your own table before you write them into the draft.
Related